Here are the Most Important Points about Inferential vs Descriptive Statistics
Inferential statistics is a branch of statistics in which conclusions are drawn from data that were not used to collect the data. In contrast, descriptive statistics involves using information from a sample of the population to draw conclusions about the whole population.
In inferential statistics, you take what you have learned from your study and generalise it to a larger group - in most cases, this means making predictions about how likely certain behaviours, characteristics or other traits are for an entire population based on data collected from a subset of that population (i.e., you learn something about part of the whole).
One of the most important applications of inferential statistics is hypothesis testing. In hypothesis testing, you use data from a sample to test a specific hypothesis about that sample. If the data support the hypothesis, you can be reasonably sure that the hypothesis is true for the population as a whole. If the data do not support the hypothesis, you can conclude that the hypothesis is false for the population as a whole.
On the other hand, descriptive statistics tell us about our data but don't show how those data might generalise to a larger population. Descriptive statistics can give us a good idea of the shape of our data, the center of our data, and the variability of our data. But it can't tell us anything about any of those characteristics.
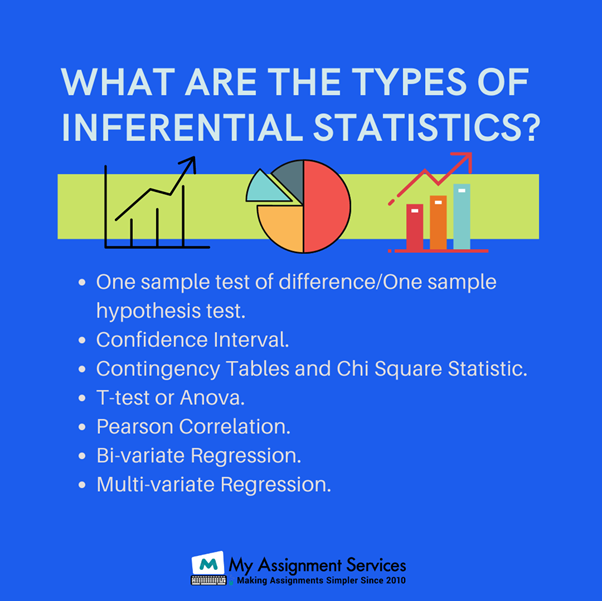
One important application of descriptive statistics is in constructing confidence intervals. A confidence interval is a range of values within which we can be 95% certain that the true value for the population lies.
So Which Type of Statistics is More Important?
The answer is that both inferential and descriptive statistics are important. Descriptive statistics tell us about the characteristics of our data, and inferential statistics help us draw conclusions from those data. Inferential statistics are more useful for making predictions about a larger population.
Inferential vs Descriptive Statistics
The difference between inferential and descriptive statistical analyses is that inferential makes use of probabilities to find the answer, whereas the latter makes use of non-probability to draw conclusions that may or may not be valid if taken as conclusive evidence to support an inference.
The following table elaborates the difference between descriptive and inferential statistics:
Descriptive Statistics vs. Inferential Statistics
- The analysis of numerical data using the concepts and techniques of probability. The analysis of numerical data using probabilities to make inferences about a population from a sample taken from that population.
- It focuses on describing the available information. It makes use of probabilities to determine the chance that an outcome will occur in future experiments.
- It is based on calculations with actual numbers obtained through observations and measurements. It uses calculated probabilities to determine the chance that an outcome will occur in future experiments.
- It is associated with non-probability sampling methods such as census, simple random sampling and systematic convenience sampling (simple random sampling and systematic convenience sampling are probability sampling methods). It is only associated with probability sampling methods.
- It is used to find out the center, shape and variability of data. It is used to make inferences about a population from a sample.
So, inferential statistics is more important than descriptive statistics as it helps in making predictions about a larger population on the basis of data collected from a subset of that population. However, both play an important role in any data analysis.
When studying at higher levels, like at the graduate or postgraduate level, you will be required to use inferential statistics almost exclusively. This is because your research will focus on generalising populations rather than describing the characteristics of individual data points. However, descriptive statistics are still important for understanding your data and for constructing confidence intervals. In short, inferential statistics helps us make predictions about populations, while descriptive statistics helps us understand our data. Both types of statistics are important for any data analysis.
Inferential vs Descriptive Statistics | Know the Most Crucial Points
- inferential statistics make use of probabilities and can be used to determine the chances that an outcome will happen in future experiments
- descriptive statistics describe the available information and are used to find out the center, shape and variability of data
- inferential statistics is more important than descriptive statistics as it helps in making predictions about a larger population on the basis of data collected from a subset of that population
- However, both types of statistics are important for any data analysis.
What Is the Difference Between Inferential and Descriptive Statistics?
- inferential statistics make use of probabilities and can be used to determine the chances that an outcome will happen in future experiments
- descriptive statistics describe the available information and are used to find out the centre, shape and variability of data
- inferential statistics is more important than descriptive statistics as it helps in making predictions about a larger population on the basis of data collected from a subset of that population
- However, both play an important role in any data analysis.
- inferential vs descriptive is a common comparison in data analysis
- while descriptive statistics simply describe data, inferential stats make use of probabilities to find answers about populations
- inferential stats are more important than descriptive stats, as they help in making predictions about larger populations
- However, both are important for data analysis in general. What We Know Now:
- Inferential vs descriptive is a common comparison in data analysis. While descriptive statistics simply describe data, inferential stats make use of probabilities to find answers about populations.
- inferential stats are more important than descriptive, as they help in making predictions about larger populations
Benefits of Inferential vs Descriptive Statistics
- inferential statistics can help us understand our data better and construct confidence intervals
- descriptive statistics are important for understanding data
- inferential stats are used more often in research at higher levels, like at the graduate or postgraduate level
- However, both types of statistics are important for any data analysis. So, while descriptive statistics are important for understanding your data, inferential stat plays a more crucial role in helping you make predictions about populations. Both types of statistics are important for any data analysis and should be used together to get a complete picture of your data. Thank you for reading! Inferential vs Descriptive Statistics Inferential Statistics -Inferential statistics makes use of probabilities to determine chances that an outcome will happen in future experiments.
- Inferential statistics help in making predictions about larger populations on the basis of data collected from a subset of that population.
- Inferential statistics is more important than descriptive statistics.
- However, both play an important role in any data analysis Descriptive Statistics -Descriptive statistics are used to find out the center, shape and variability of data.
- Descriptive Statistics simply describe data.
- While descriptive statistics are important, inferential stats are more important as they help in making predictions about larger populations.
- Both types of statistics are important for data analysis in general. What We Know Now: Inferential vs Descriptive Statistics is a common comparison in data analysis. While descriptive statistics simply
What We Know Now:
- inferential vs descriptive statistics is a common comparison in data analysis
- while descriptive statistics simply describe data, inferential stats make use of probabilities to find answers about populations
- inferential stats are more important than descriptive, as they help in making predictions about larger populations
- However, both are important for data analysis in general.
The Wrap
Inferential vs descriptive is a common comparison in data analysis. While descriptive statistics simply describe data, inferential stats make use of probabilities to find answers about populations. Inferential stats are more important than descriptive, as they help in making predictions about larger populations. However, both are important for data analysis in general.
Statistics is a branch of mathematics that deals with collecting, analysing, interpreting, presenting, and organisation of data. It is used in a variety of fields, including business, economics, health care, and sociology. Most students find Statistics to be a challenging subject. This is because it involves a lot of concepts that are new to them. In addition, there are a lot of formulas to remember and techniques to apply. If you are struggling with your Statistics coursework, don't worry. You can get assistance from our professionals via guided sessions of Statistics Assignment Help. My Assignment Services are always there for you! Just ask us by filling the form.
Related Study Materials
Our Experts can answer your Assignment questions instantly.
Ask Question0 Comment
![]()



Loved reading this Blog? Share your valuable thoughts in the comment section.
Add comment